RADOLAN adjustment example with OpenMRG CML data
[1]:
%load_ext autoreload
%autoreload 2
[2]:
import matplotlib.pyplot as plt
import numpy as np
import poligrain as plg
import xarray as xr

import mergeplg as mrg
Load OpenMRG data
[3]:
ds_rad, ds_cmls, ds_gauges, ds_gauges_smhi = mrg.io.load_and_transform_openmrg_data()
Transform the CML data from Dataset to DataFrame because the old RADOLAN code expects this as input, also with some specific colums that have to be present
[4]:
df_cmls = mrg.radolan.io.transform_openmrg_data_for_old_radolan_code(ds_cmls)
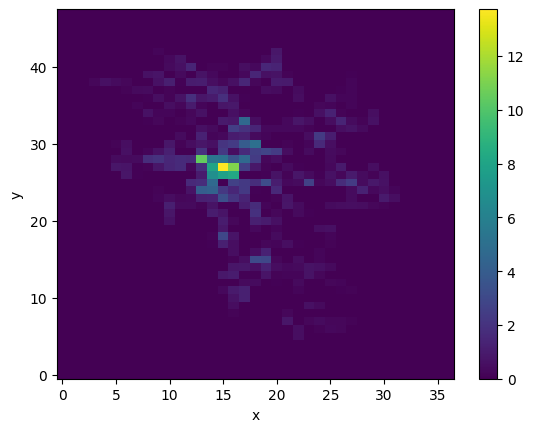
Calculate intersection weights
These need to be passed into the function that does the adjustment
[5]:
# x_grid, y_grid = np.meshgrid(ds_rad.x.values, ds_rad.y.values)

intersection_weights = plg.spatial.calc_sparse_intersect_weights_for_several_cmls(
    x1_line=ds_cmls.site_0_x.values,
    y1_line=ds_cmls.site_0_y.values,
    x2_line=ds_cmls.site_1_x.values,
    y2_line=ds_cmls.site_1_y.values,
    cml_id=ds_cmls.cml_id.values,
    x_grid=ds_rad.xs.data,
    y_grid=ds_rad.ys.data,
    grid_point_location="lower_left",
)
[6]:
intersection_weights.sum(dim="cml_id").plot();
Loop through all time stamps and do adjustment
[7]:
# need to set this variable since the old RADOLAN code starts with this
ds_rad["RH"] = ds_rad.rainfall_amount
[8]:
ds_radolan_t_list = []
df_stations_t_list = []
for t in ds_rad.time.data:
    ds_radolan_t, df_stations_t = mrg.radolan.processing.rh_to_rw(
        ds_radolan_t=ds_rad.sel(time=t),
        df_stations_t=df_cmls.loc[t, :],
        allow_gauge_and_cml=True,
        intersect_weights=intersection_weights,
        max_distance=30e3,
    )
    ds_radolan_t_list.append(ds_radolan_t)
    df_stations_t_list.append(df_stations_t)

ds_radolan = xr.concat(ds_radolan_t_list, dim="time")
The adjusted product is called RW. Note that for DWD’s radar-adjustment product, the RW product is an hourly radar-gauge adjustment. Here, we apply the same adjustment steps to the 5min data. Radar-adjustment at this temporal resolution is challenging due to spatio-temporal mismatch of radar observations and ground observations from gauge and/or CML.
All intermediate products of the RADOLAN adjustment method are stored in the returned xr.Dataset
[9]:
ds_radolan.data_vars
[9]:
Data variables:
    crs                          (time) int32 124B 1 1 1 1 1 1 1 ... 1 1 1 1 1 1
    latitudes                    (time, y, x) float32 220kB 57.21 ... 58.06
    longitudes                   (time, y, x) float32 220kB 11.41 ... 12.66
    rainfall_amount              (time, y, x) float64 440kB 0.01078 ... 0.05403
    RH                           (time, y, x) float64 440kB 0.01078 ... 0.05403
    RG                           (time, y, x) float64 440kB 0.01078 ... 0.05403
    RB                           (time, y, x) float64 440kB 0.01078 ... 0.05403
    dbr_interim                  (time, y, x) float64 440kB 0.0 0.0 ... 0.0 0.0
    fbr_interim                  (time, y, x) float64 440kB 1.0 1.0 ... 1.0 1.0
    addiff_interim               (time, y, x) float64 440kB 0.01078 ... 0.05403
    mulfak_interim               (time, y, x) float64 440kB 0.01078 ... 0.05403
    weight_addiff_interim_audit  (time, y, x) float64 440kB 0.5 0.5 ... 0.5 0.5
    weight_mulfak_interim_audit  (time, y, x) float64 440kB 0.5 0.5 ... 0.5 0.5
    dbr_relevant                 (time, y, x) float64 440kB 0.0 0.0 ... 0.0 0.0
    fbr_relevant                 (time, y, x) float64 440kB 1.0 1.0 ... 1.0 1.0
    addiff_relevant              (time, y, x) float64 440kB 0.01078 ... 0.05403
    mulfak_relevant              (time, y, x) float64 440kB 0.01078 ... 0.05403
    RW_not_rounded               (time, y, x) float64 440kB 0.01078 ... 0.05403
    RW                           (time, y, x) float64 440kB 0.0 0.0 ... 0.0 0.0
    RW_interim                   (time, y, x) float64 440kB 0.01078 ... 0.05403
    RR                           (time, y, x) float64 440kB nan nan ... nan nan
    RW_no_station_fill           (time, y, x) float64 440kB 0.0 0.0 ... 0.0 0.0
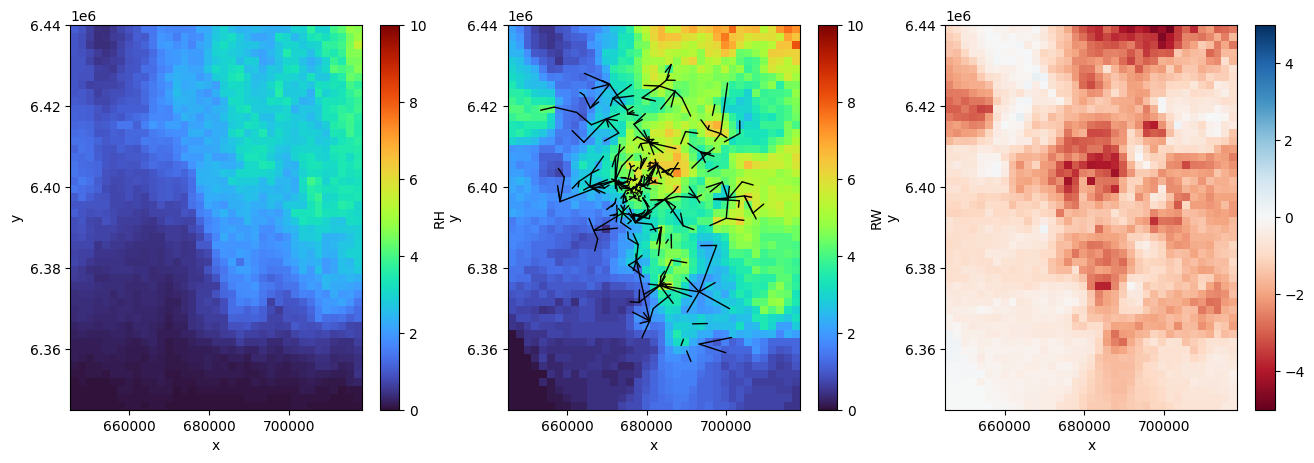
Compare unadjusted and adjusted radar rainfall fields
Look at rainfall sum of example dataset
[10]:
vmin, vmax = 0, 10
cmap = "turbo"
fig, axs = plt.subplots(1, 3, figsize=(16, 5))
ds_radolan.sum(dim="time").RH.plot(ax=axs[0], vmin=vmin, vmax=vmax, cmap=cmap)
ds_radolan.sum(dim="time").RW.plot(ax=axs[1], vmin=vmin, vmax=vmax, cmap=cmap)
(ds_radolan.sum(dim="time").RH - ds_radolan.sum(dim="time").RW).plot(
    ax=axs[2],
    vmin=-5,
    vmax=5,
    cmap="RdBu",
)

plg.plot_map.scatter_lines(
    x0=ds_cmls.site_0_x,
    x1=ds_cmls.site_1_x,
    y0=ds_cmls.site_0_y,
    y1=ds_cmls.site_1_y,
    ax=axs[1],
    s=1,
    c="k",
)
[10]:
<matplotlib.collections.LineCollection at 0x138fe5690>
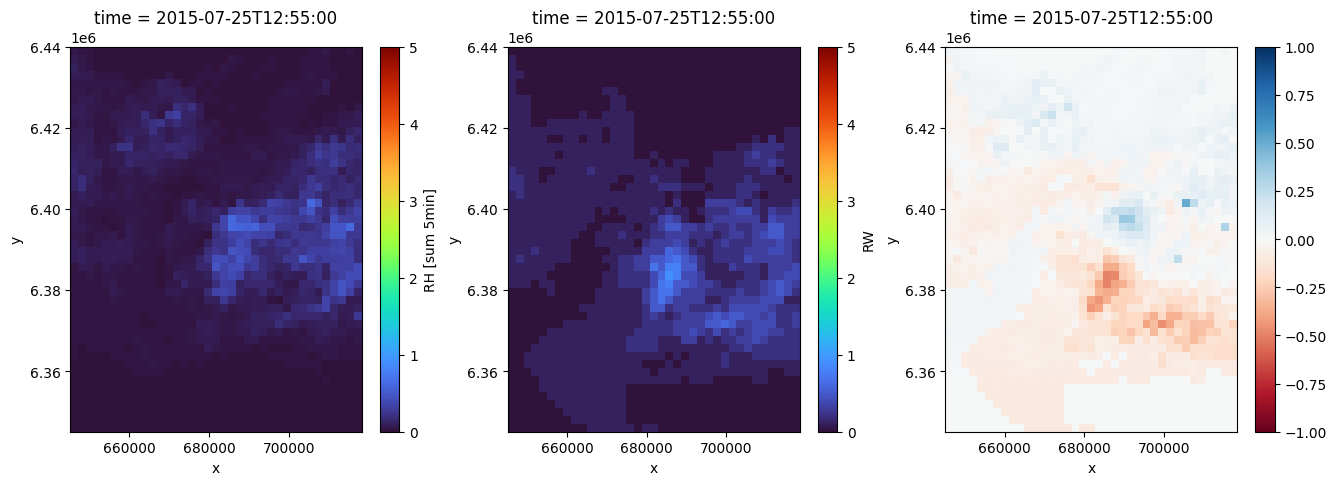
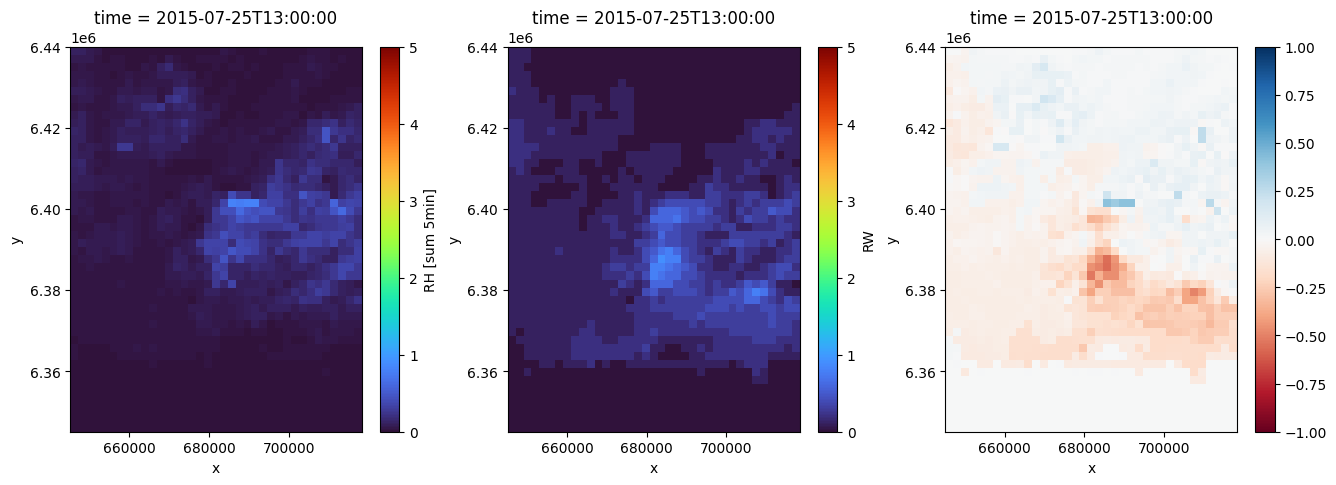
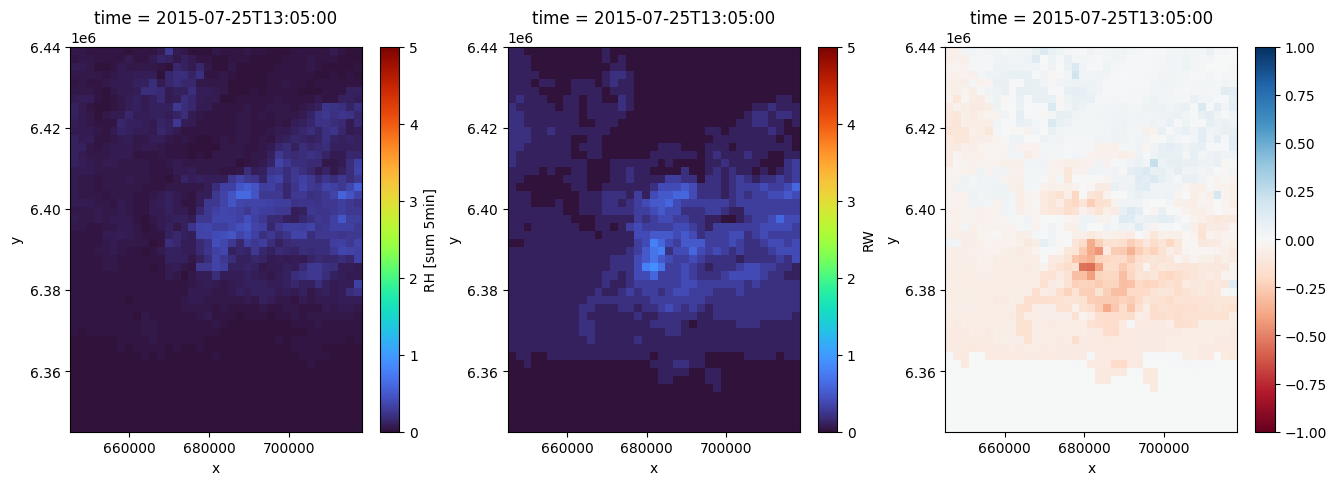
Look at individual time stamps
[11]:
for t in ds_radolan.time.data[5:8]:
    vmin, vmax = 0, 5
    cmap = "turbo"
    fig, axs = plt.subplots(1, 3, figsize=(16, 5))
    ds_radolan.sel(time=t).RH.plot(ax=axs[0], vmin=vmin, vmax=vmax, cmap=cmap)
    ds_radolan.sel(time=t).RW.plot(ax=axs[1], vmin=vmin, vmax=vmax, cmap=cmap)
    (ds_radolan.sel(time=t).RH - ds_radolan.sel(time=t).RW).plot(
        ax=axs[2],
        vmin=-1,
        vmax=1,
        cmap="RdBu",
    )
Validate unadjusted and adjusted radar rainfall fields at gauge locations
[12]:
# We need to add these to comply with the OPENSENSE naming conventions
ds_rad.coords["lon"] = ds_rad.longitudes
ds_rad.coords["lat"] = ds_rad.latitudes

grid_at_points = plg.spatial.GridAtPoints(
    da_gridded_data=ds_rad.rainfall_amount,
    da_point_data=ds_gauges.rainfall_amount,
    nnear=1,
)

ds_gauges.coords["id"] = ds_gauges.station_id
[13]:
radar_at_gauges = grid_at_points(
    da_gridded_data=ds_rad.rainfall_amount,
    da_point_data=ds_gauges.rainfall_amount,
)

RW_at_gauges = grid_at_points(
    da_gridded_data=ds_radolan.RW_not_rounded,
    da_point_data=ds_gauges.rainfall_amount,
)
[14]:
extent = [0, 1.5, 0, 1.5]
gridsize = 15

fig, axs = plt.subplots(1, 2, figsize=(12, 5))

axs[0].hexbin(
    ds_gauges.rainfall_amount,
    radar_at_gauges,
    mincnt=1,
    extent=extent,
    gridsize=gridsize,
    bins="log",
)

axs[1].hexbin(
    ds_gauges.rainfall_amount,
    RW_at_gauges,
    mincnt=1,
    extent=extent,
    gridsize=gridsize,
    bins="log",
);
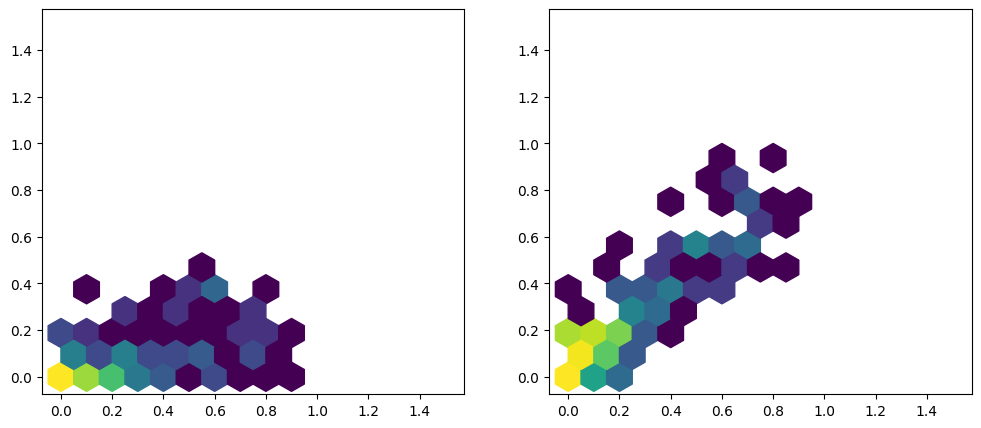
[15]:
R_gauge = ds_gauges.rainfall_amount.data.flatten()
R_unadjusted = radar_at_gauges.data.flatten()
R_adjusted = RW_at_gauges.data.flatten()

corr_unadjusted = np.corrcoef(R_gauge, R_unadjusted)[0, 1]
corr_adjusted = np.corrcoef(R_gauge, R_adjusted)[0, 1]

rmse_unadjusted = np.sqrt(np.mean((R_gauge - R_unadjusted) ** 2))
rmse_adjusted = np.sqrt(np.mean((R_gauge - R_adjusted) ** 2))

print("  unadjusted adjusted")
print(f"PCC:  {corr_unadjusted:0.2f}     {corr_adjusted:0.2f}")
print(f"RMSE: {rmse_unadjusted:0.2f}     {rmse_adjusted:0.2f}")
  unadjusted adjusted
PCC:  0.63     0.87
RMSE: 0.20     0.11